Coastal Dead Zones

by Nasa/gsfc/science Photo Library
Title
Coastal Dead Zones
Artist
Nasa/gsfc/science Photo Library
Medium
Photograph - Photograph
Description
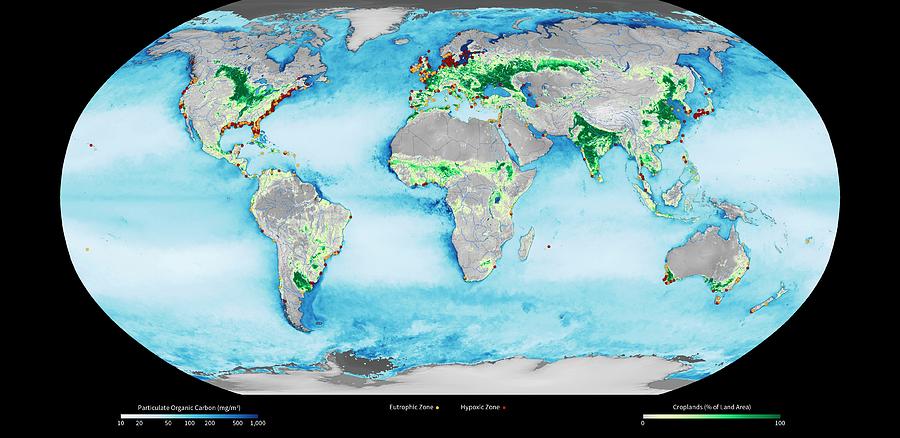
Coastal dead zones. Global satellite map showing the distribution of croplands (green), marine coastal dead zones (hypoxic zones, red dots), eutropic zones (yellow dots), and levels of particulate organic carbon (POC, blue), a measure of water quality. The eutrophic zones are where fertiliser run-off causes algal blooms that can deplete the water of oxygen and cause hypoxic zones, resulting in severe and mass loss of fish and other sea life. The eutrophication and hypoxia data set is from the Virginia Institute of Marine Science (VIMS) and the World Resources Institute (WRI). The POC data is from the Visible Infrared Imaging Radiometer Suite (VIIRS) on the Suomi National Polar-orbiting Partnership (NPP) weather satellite.
Uploaded
September 16th, 2018
Embed
Share
Comments
There are no comments for Coastal Dead Zones. Click here to post the first comment.


